Front Panel
IsolaRail exposes local status through a 160x50 pixel dashboard aligned to the four physical ports. The complete layout spec is docs/dashboard_spec.md.
Layout
- Logical resolution:
160x50 px - Four equal columns:
40 pxeach - Columns map to
port1..port4 - The production layout does not show column headers, preserving space for values and state icons
The dashboard is a hardware status surface, not a promotional display. It should answer:
- Which port is selected?
- Which ports have voltage, current, and power?
- Which ports are disconnected, closed, initializing, or over-current?
- Which port will be affected by a Center press?
Row budget:
String budget
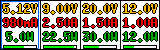
Each column has roughly 36 px of text width. With 7 px advance glyphs, value rows fit about 5 characters:
- Voltage:
5.12V,20.0V,9.00V - Current:
0.98A,2.50A,650mA - Power:
4.9W,22.5W,750mW - Unknown:
--
Values must be clamped or degraded to the column budget and must not push into adjacent columns.
Formatting rules:
If a value still does not fit, reduce precision before falling back to --.
States
Dashboard states are compact rather than verbose:
- Normal: V/I/W values and power bar.
- Disconnected: icon plus
DISC. - Over-current:
CCicon, no power value or power bar. - Closed: plug-disconnected icon plus
OFF. - Initializing: all three rows show
--.
The selected column uses a thin cyan inset rectangle. It must not cover values or icons.
State priority:
Over-currentClosedDisconnectedInitializingNormal
Protection shutdowns should render as over-current, not as a normal unplug or power-off state.
Input mapping
The five-way switch maps to:
- Left / Right: cycle selection across the four columns.
- Center short press: manually disconnect or restore output power for the selected port.
- Center long press: reserved for a future quick menu.
- Up / Down: reserved for future display modes or detail views.
Manual disconnect takes priority over telemetry display; the column shows OFF.
The front-panel task publishes key events only. Runtime owns the final output decision and still evaluates VIN, CH335F sideband, OCP latch, and owner manual state.
Refresh
- Periodic refresh:
2 Hz, every 500 ms. - Current and power can use a 1-2 second sliding average to reduce flicker.
- State transitions or values changing by at least 10% should redraw immediately.
Refresh sources:
- periodic telemetry: voltage, current, power, temperature
- runtime state: OCP latch, sideband fault, manual closed
- front-panel events: selection changes and Center toggle
- boot handoff: the first frame after self-check
Front-panel events redraw immediately instead of waiting for the next 500 ms tick.
Color and asset constraints
- Background: white.
- Default text / borders: black.
- Voltage: deep yellow.
- Current: red.
- Power values and bars: green.
- Selected column: cyan inset.
The preview SVGs are pixel-level spec assets where each pixel is represented as a 1x1 rect.
Runtime data semantics
Dashboard V/I/W values prefer the per-port INA226. Power is computed as W = V x I. Initializing, read failures, or missing sensors must not be faked as zero; show -- or the matching state.
Preview assets
Normal:
Mixed states:
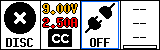
These SVGs are pixel-level previews made from 1x1 rectangles and serve as dashboard spec assets.
References
docs/dashboard_spec.mddocs/assets/dashboard_wireframe_160x50_color_bold.svgdocs/assets/dashboard_wireframe_160x50_states_color_bold.svg